Short: FINRA short interest and the daily short-volume ratio
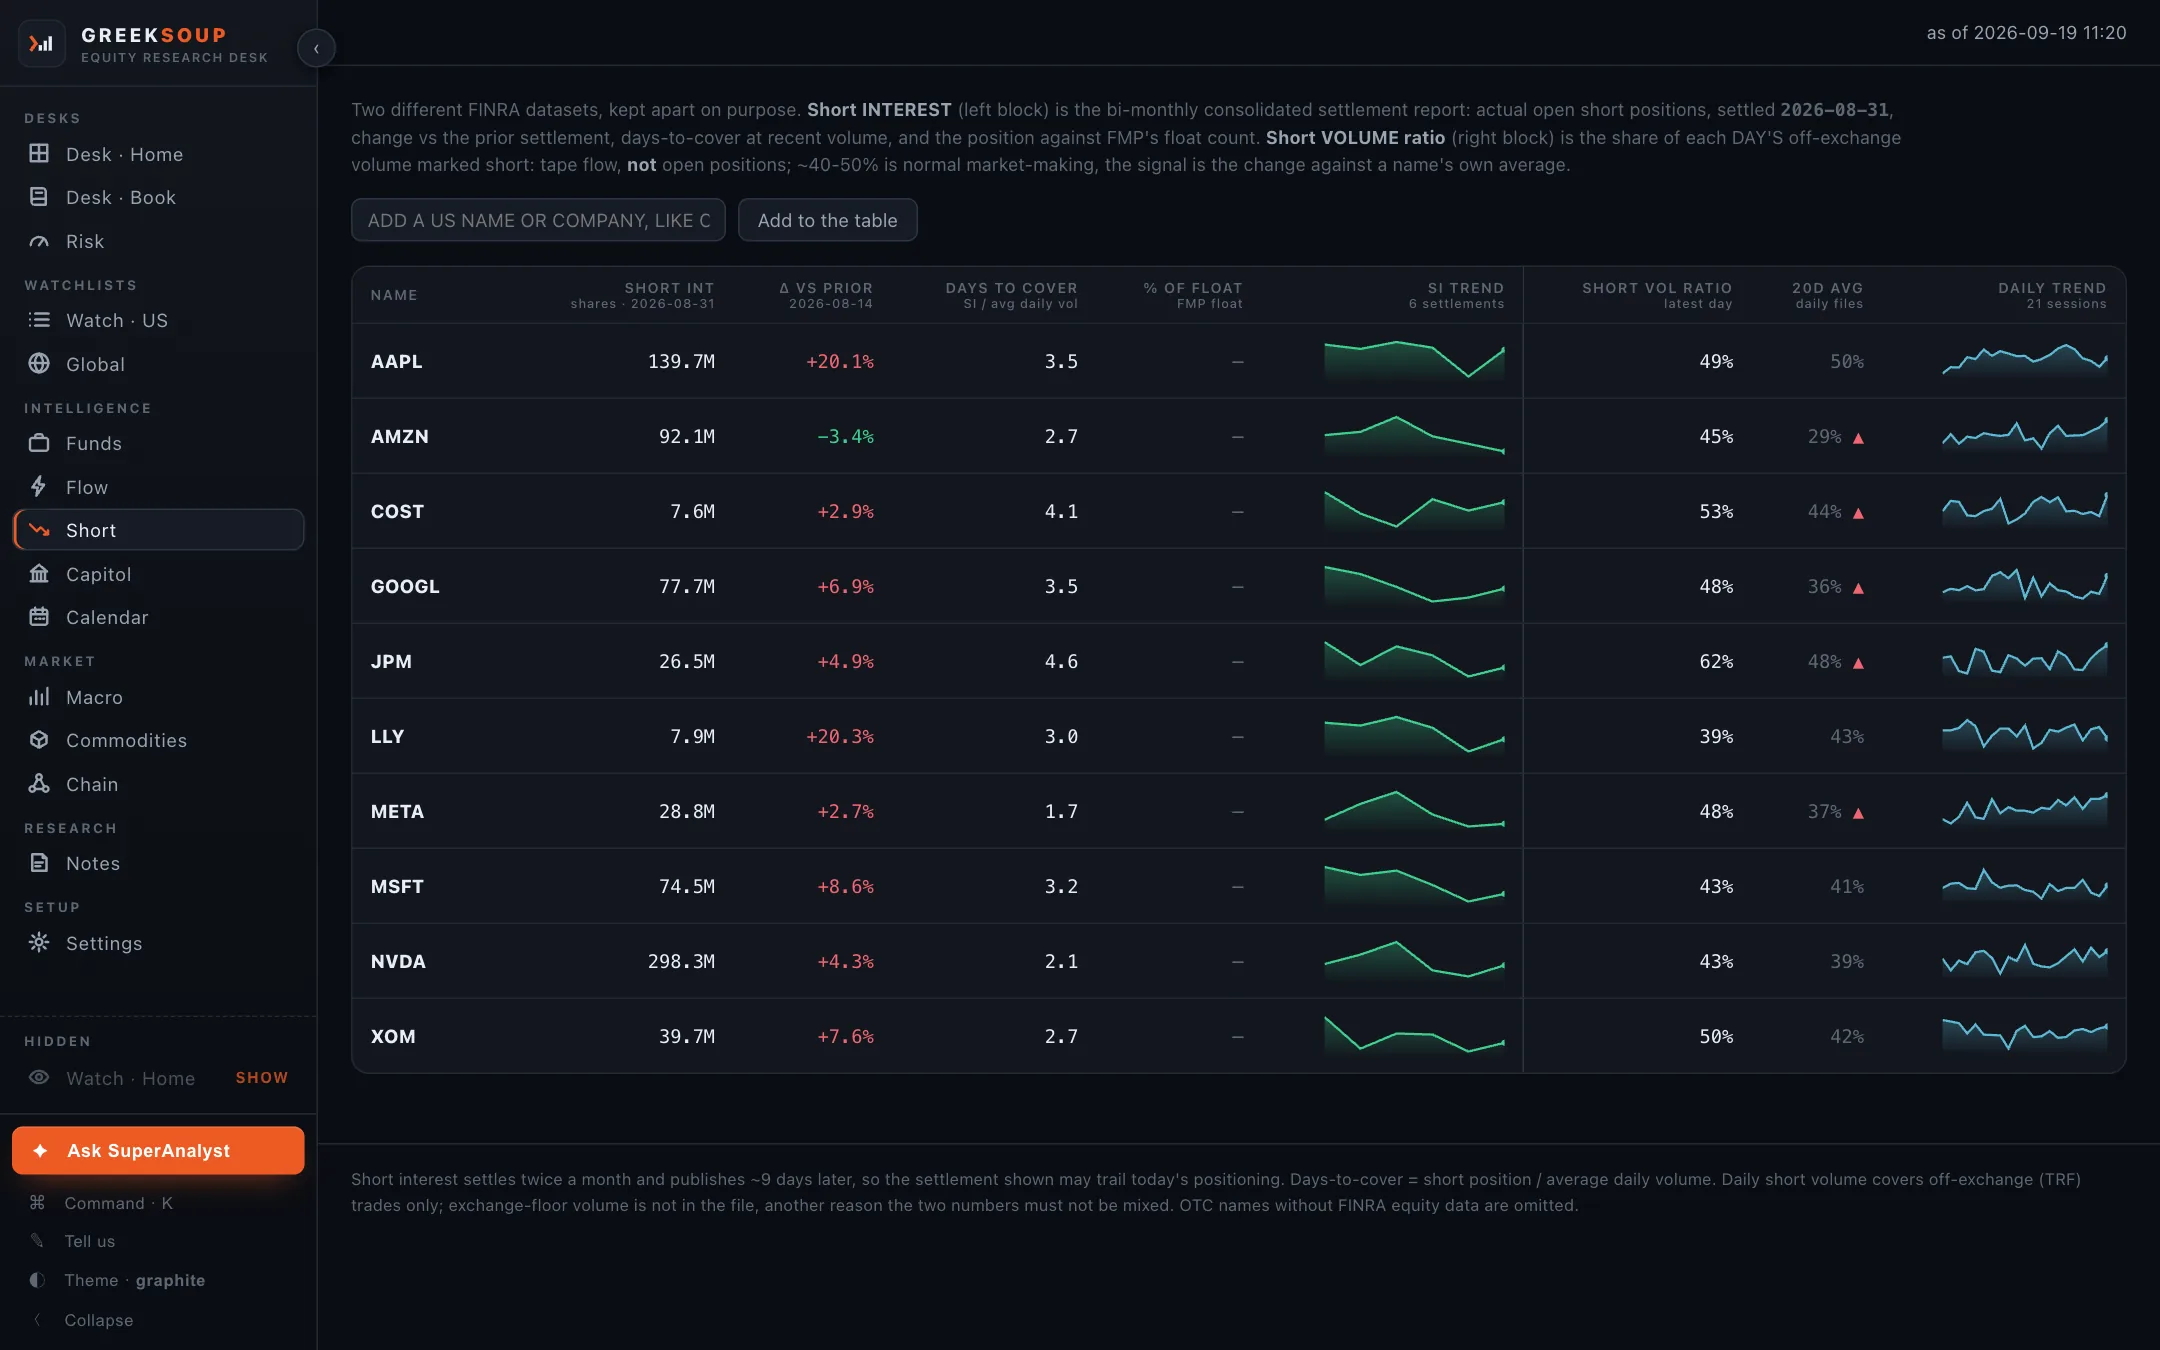
Two different FINRA datasets on one screen, kept apart on purpose. The left block is open short positions at the last settlement; the right block is the share of each day's off-exchange volume marked short. They answer different questions and must not be mixed.
What it shows
Short interest (left): actual open short positions at the settlement date named in the header, the change against the prior settlement, days to cover at recent average volume, the position as a percent of float where a float count is available, and a sparkline of the last six settlements.
Short-volume ratio (right): the latest day's share of off-exchange volume marked short, the twenty-day average, and a sparkline of the last twenty-two sessions. Forty to fifty percent is normal market-making; the signal is a change against a name's own average, and a rising arrow marks a day above its average.
Two honest notes, printed on the screen: short interest settles twice a month and publishes about nine days later, so the settlement shown can trail today's positioning; daily short volume covers off-exchange trades only, since exchange-floor volume is not in FINRA's file. OTC names without FINRA equity data are left out.
Where each number comes from
| Number | Source |
|---|---|
| Short interest, change, days to cover, settlement dates | FINRA's consolidated short interest files |
| Short-volume ratio and its trend | FINRA's daily short sale volume files |
| Percent of float | The data provider's float count, when a key is set; a dash without one |
What you can do here
- Add a US name at the top. The list is the names you hold and watch plus any you add here.
- Click a name for its ticker page.