Flow: the options tape on any US stock
What the options market is positioned for on each of your US names, read from CBOE's free fifteen-minute-delayed chains over a ninety-day expiry window. It describes positioning only; it makes no call.
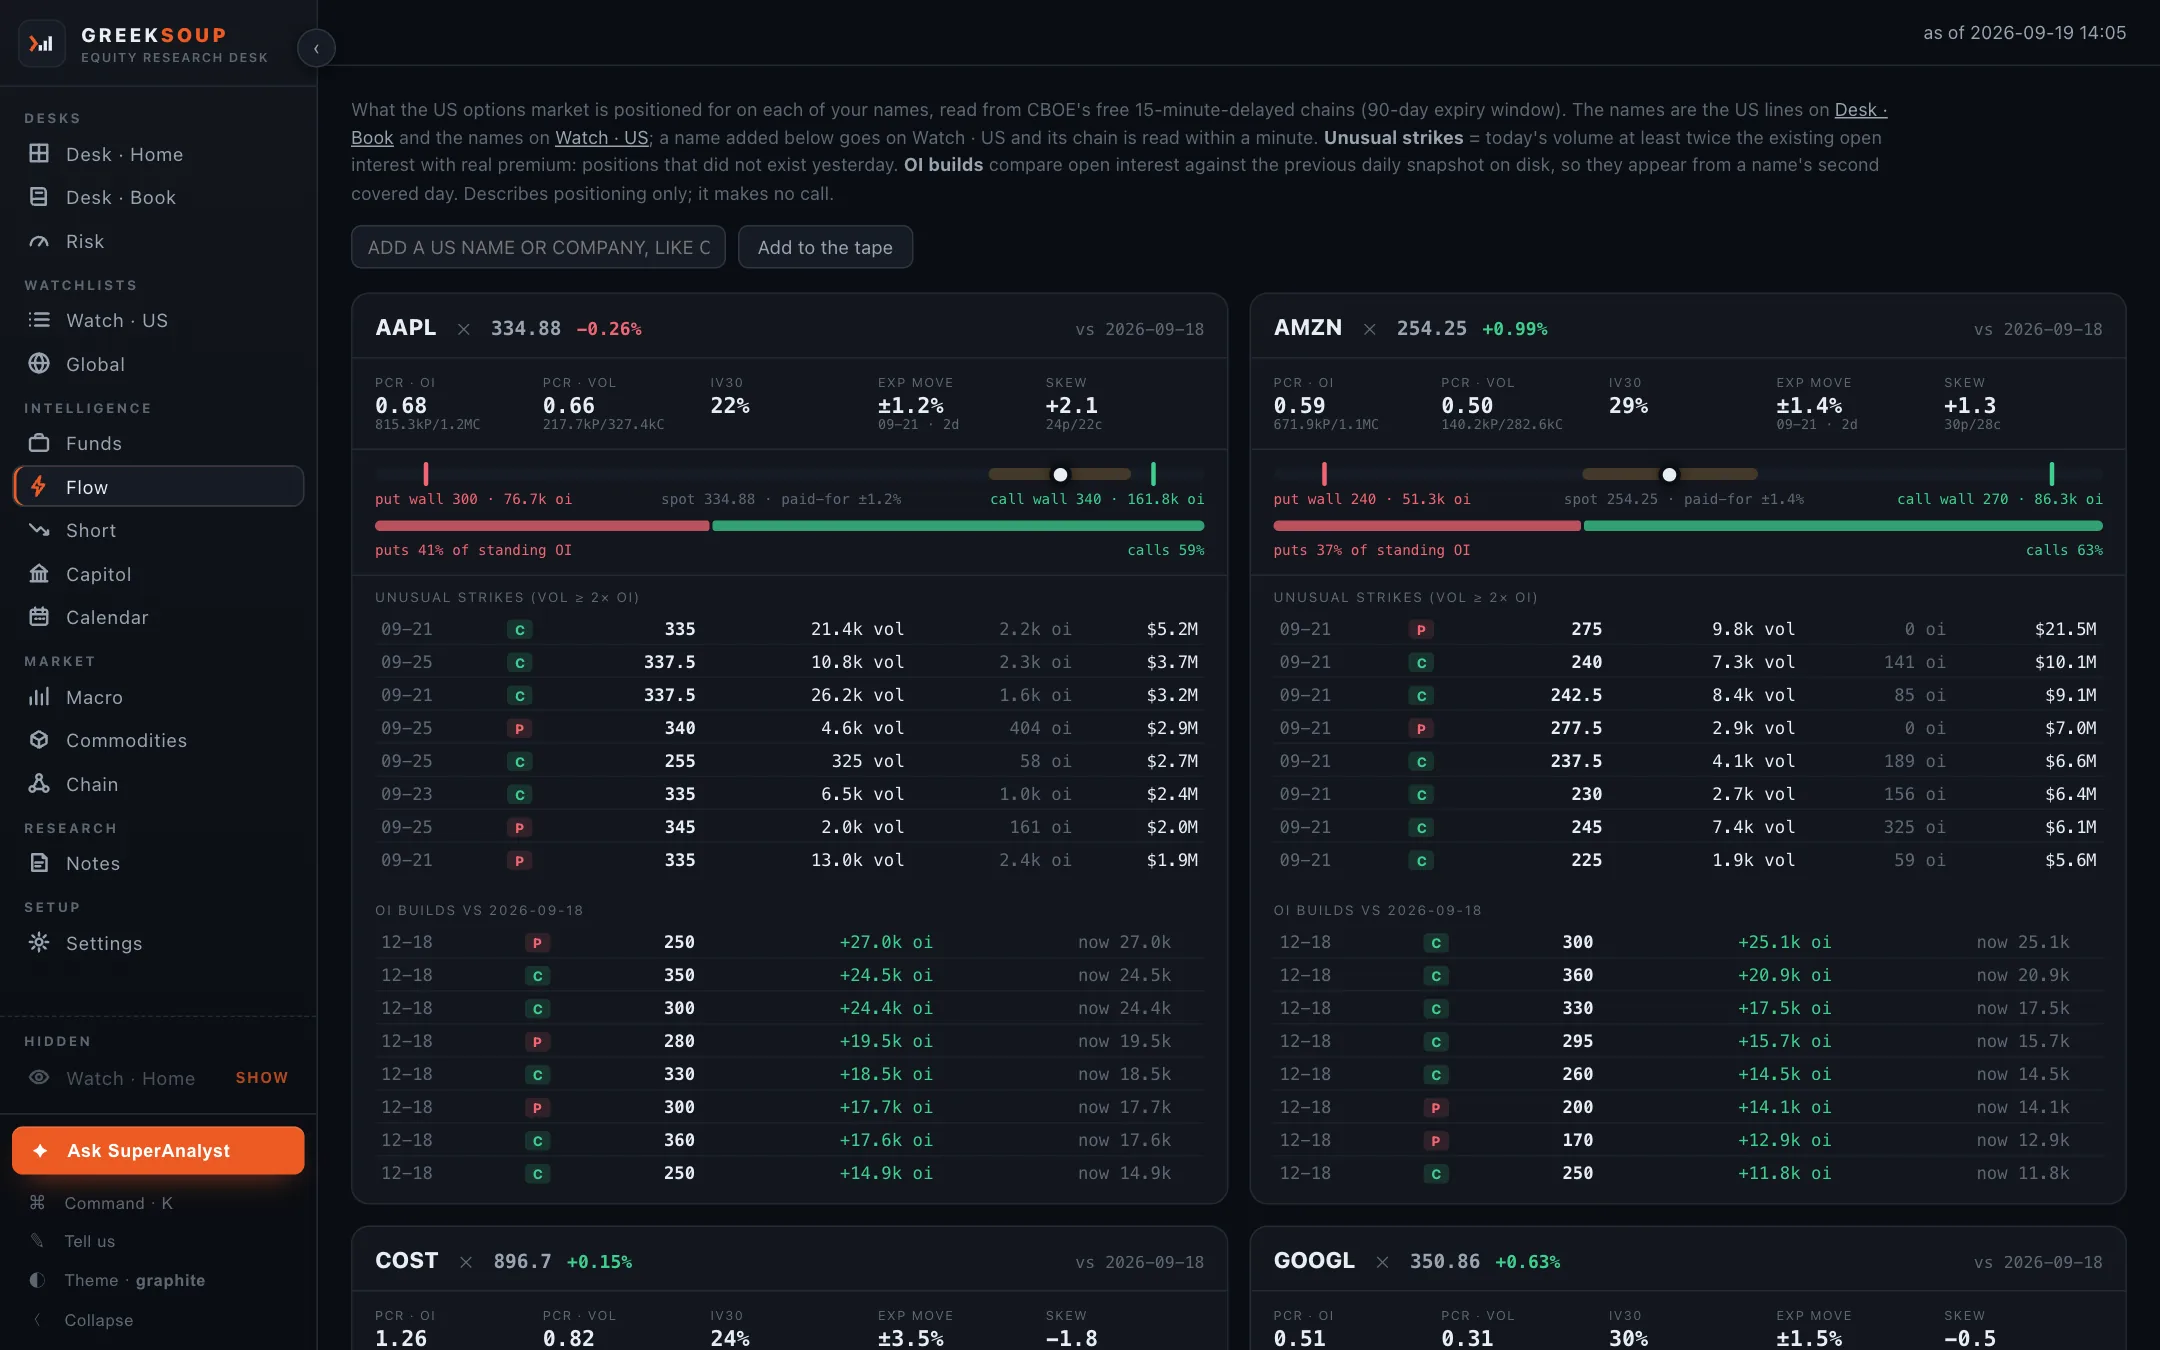
What it shows
One card per name. Spot and the day's move, then five numbers: put/call on open interest, put/call on volume, thirty-day implied volatility, the expected move to the nearest expiry with its date, and skew (the put's implied volatility against the call's at the same distance).
The walls. The strike with the most put open interest below spot and the strike with the most call open interest above it, drawn on a bar with spot between them and the paid-for expected move around it. Under the bar, how the standing open interest splits between puts and calls.
Unusual strikes. Today's volume at least twice the existing open interest, with real premium: positions that did not exist yesterday. Expiry, put or call, strike, volume, open interest and the premium traded.
OI builds. Open interest compared against the previous daily snapshot the desk keeps on disk, so they appear from a name's second covered day. A card on its first day says so.
Where each number comes from
| Number | Source |
|---|---|
| Every chain | CBOE's free delayed chains, fifteen minutes behind, read by the desk |
| Spot | The same feed |
| Yesterday's open interest | The desk's own snapshot from the day before |
Nothing on this screen uses a key.
What you can do here
- Add a US name at the top; it goes on Watch · US and its chain is read within a minute. The names on the tape are the US lines on Desk · Book and the names on Watch · US.
- Remove a name with the cross beside it.
- Click a name for its ticker page.