Risk: every book against its index
How much each book moves, what moves it, and what a bad index day costs, measured on the last year of daily closes. Every number carries a line of small print saying what it means.
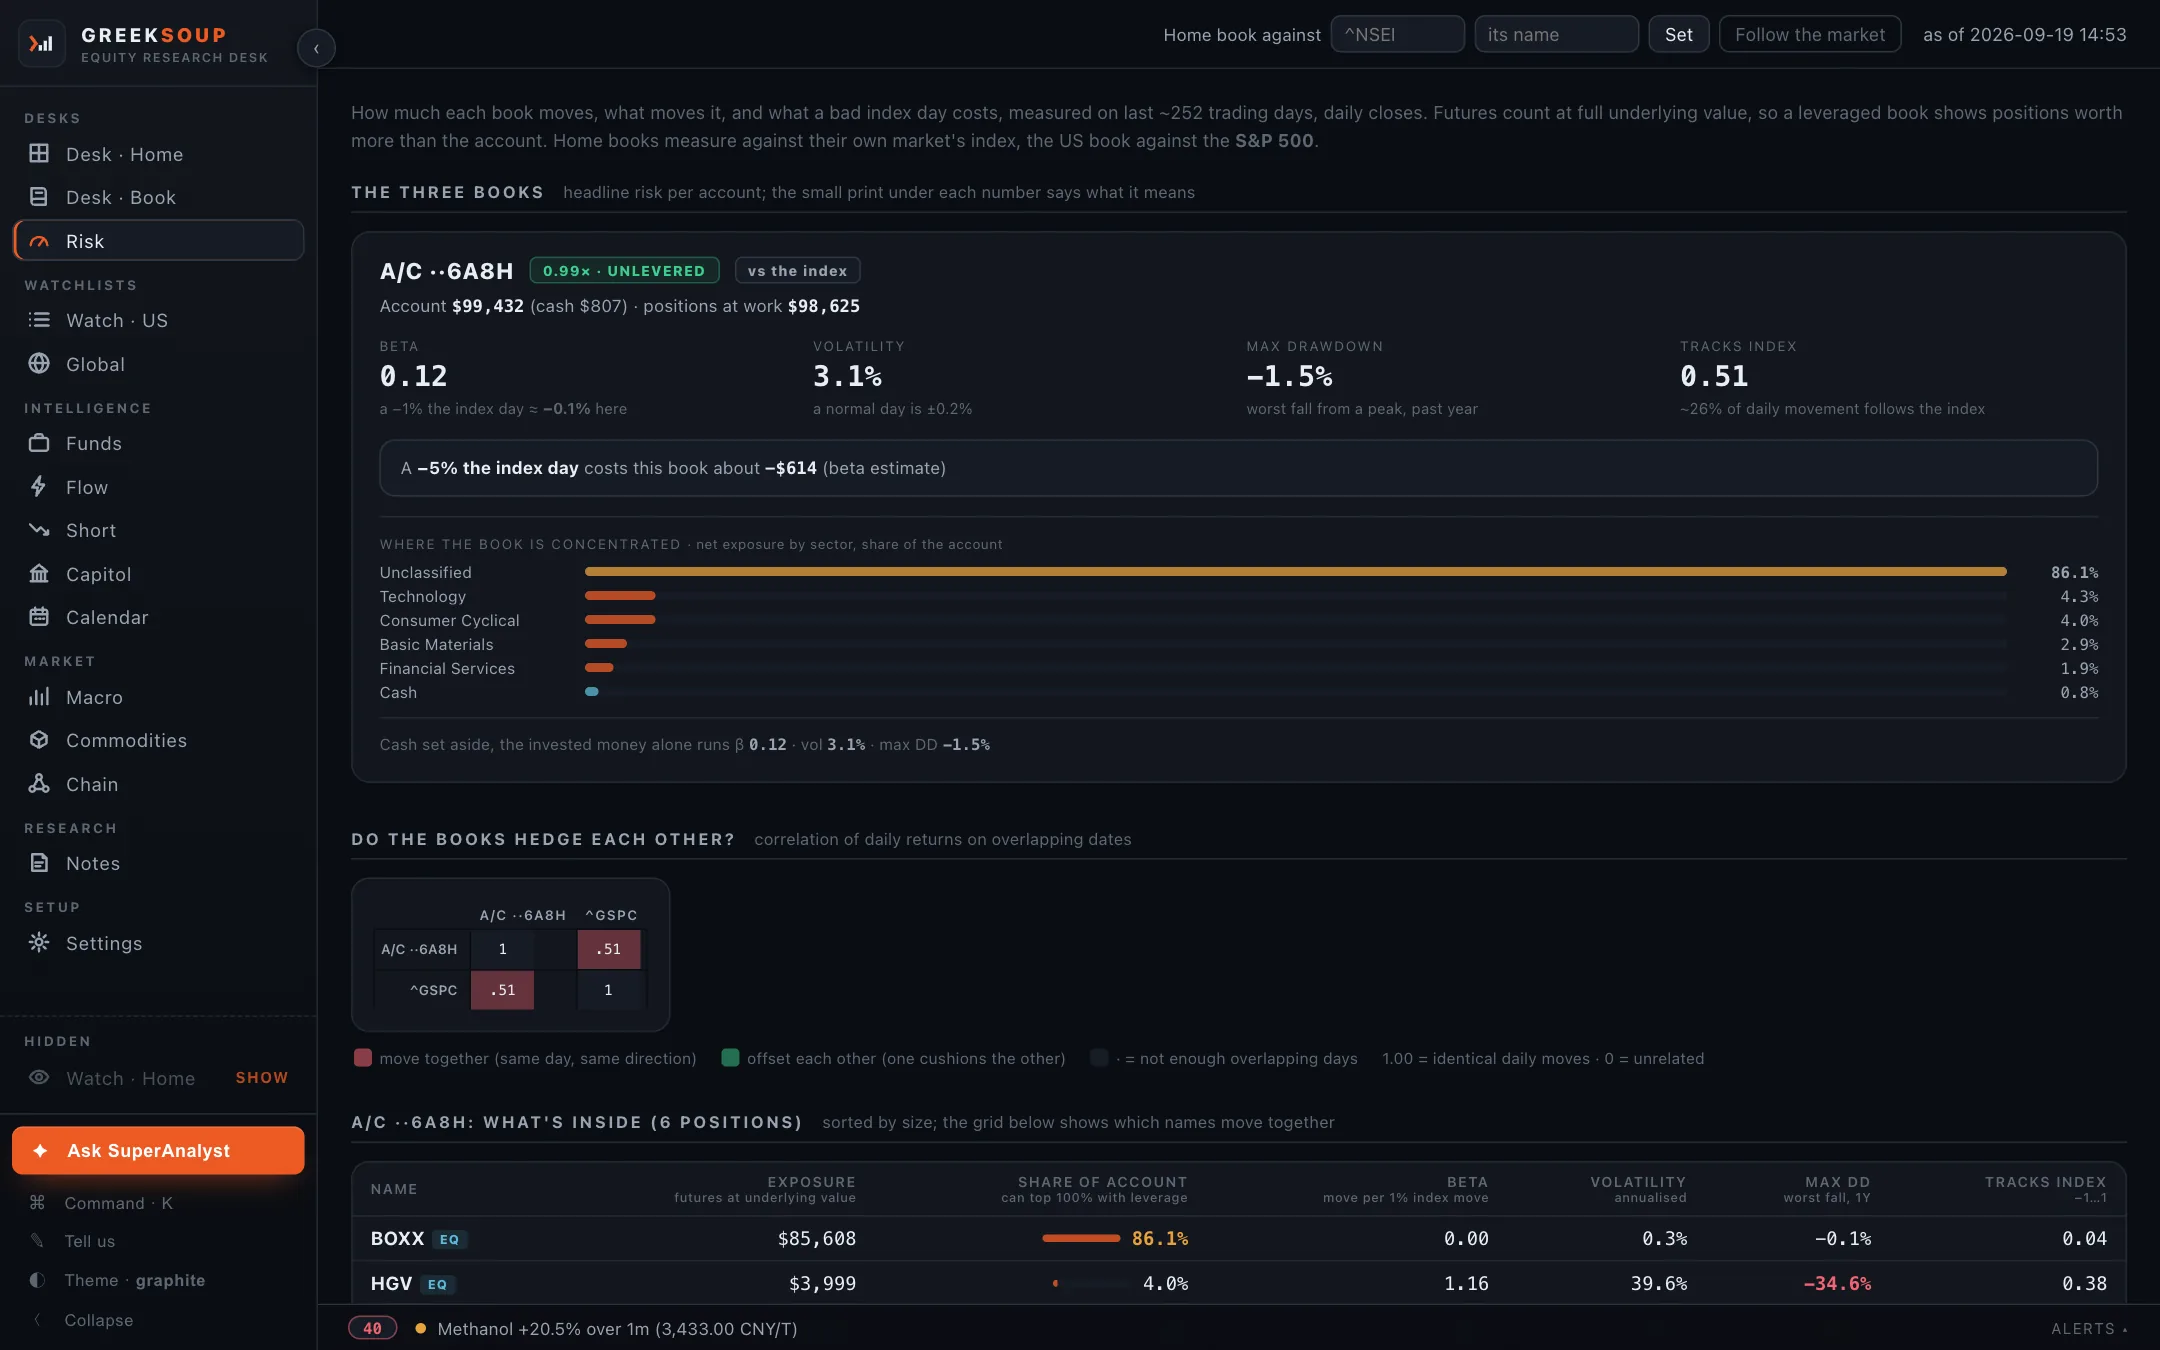
What it shows
The three books. One block per book: the broker account, the hand-kept book, the US book. Each carries the account value and cash, a leverage badge (futures count at full underlying value, so a leveraged book shows positions worth more than the account), and four numbers with their plain-English line: beta against the index, annualised volatility, the worst fall from a peak in the past year, and how much of the daily movement follows the index.
The stress line. What a five percent index day costs this book, by beta.
Where the book is concentrated. Net exposure by sector as a share of the account, cash included. Names the free feed cannot classify sit in Unclassified.
Do the books hedge each other. A correlation grid of daily returns on overlapping dates: red moves together, green offsets, grey means too few overlapping days.
What is inside. Every position with its exposure, share of the account, beta, volatility, worst drawdown and index tracking, and under it a grid of which names move together.
Where each number comes from
| Number | Source |
|---|---|
| Daily closes for every name and index | Yahoo's free feed, about 252 trading days |
| Positions and exposure | Your broker, Desk · Book and the US book |
| Sectors | Yahoo's profile for each name |
| Margin cushion | The broker, where it reports one |
The index is yours
The top bar names the index each home book measures against. The home market's own index is the default; type any Yahoo index symbol and Set to change it, or Follow the market to go back. The US book always measures against the S&P 500.
Needs no key. Needs at least one book with positions, and a history the feed answers.